1.中国海洋垃圾的来源
1. Sources of marine debris in China
传统上,海洋垃圾的来源根据进入海洋的位置分为陆源和海洋两大类。陆源排放是海洋垃圾的主要来源,例如,全球 88~95% 的海洋垃圾经 10 条大河(即印度河、恒河、阿穆尔河、湄公河、珠江、海河、黄河、长江、尼罗河和尼日尔河)排放进入海洋,其中多数在中国。中国的海洋垃圾主要包括生活垃圾和工业垃圾,此外,医疗或卫生活动也贡献了一小部分。与海洋物理循环的天然产物不同,海洋垃圾也由与海洋有关的人类活动产生,例如商业捕鱼、商船作业、沿海养鱼和近海资源开采。
The sources of marine debris have traditionally been classified into two categories, i.e., land-based and ocean-based, based on where it enters the sea. Land-based discharge is the main source of marine debris, for instance, 88–95 % of the global marine debris ensues from land-based discharge into the oceans through 10 large rivers (i.e., Indus, Ganges, Amur, Mekong, Pearl, Hai He, Yellow, Yangtze, Nile, and Niger), and half of them are partly or totally in China. Additionally, medical or sanitary activities contributed a small proportion. Differing from the natural products of the oceans’ physical cycles, ocean-based debris is additionally generated by sea-related human activities, such as commercial fishing, merchant vessel operations, coastal fish farming, and offshore resource mining.
2.中国海洋垃圾的组成及丰度
2. Composition and abundance of marine debris in China
2.1 海洋垃圾的种类和比例
2.1 Types and proportions of marine debris
根据总量分布,海洋垃圾分为搁浅海洋垃圾(BMD)、漂浮海洋垃圾(FMD)和淹没海洋垃圾(SMD)。在 2007-2018 年期间,BMD 是海洋垃圾的主要组成部分,就物体数量而言,其占总数的 90.6%,其次是 FMD(6.9%)和 SMD(2.5%)。就重量而言, 在2007-2018 年,BMD 占海洋垃圾总量的 82.1%,从 2008 年的最低 31.5% 到 2013 年的最高 97.0%不等。与基于数量观察到的组成趋势不同,SMD 占重量的比例(16.6 %)比 FMD(仅 1.3 %)更大。这可能主要是因为BMD的平均表面密度为1444 kg/km2,远高于SMD(250 kg/km2)和FMD(15 kg/km2)。2014年BMD平均表面密度最高值为3119 kg/km2,远高于2016年FMD和SMD丰度最大值分别为65 kg/km2和671 kg/km2(图1)。
Depending on the aggregate distribution, marine debris was classified as beached marine debris (BMD), floating marine debris (FMD), and submerged marine debris (SMD). During 2007–2018, BMD was the dominant component of marine debris in terms of the number of objects, with composition based on the number of items averaging 90.6 % of the total, followed by FMD (6.9 %) and SMD (2.5 %). In terms of weight, BMD accounted for 82.1 % of the total marine debris during 2007–2018, varying from the minimum of 31.5 % in 2008 to the maximum of 97.0 % in 2013. Unlike the trends observed in composition based on the number of items, SMD accounted for a greater proportion in terms of weight (16.6 %) than FMD (only 1.3 %). The average surface density of BMD was 1444 kg/km2, which was higher than those of SMD (250 kg/km2) and FMD (15 kg/km2). The highest value of BMD abundance was in 2014 at 3119 kg/km2, far greater than the maximum values of FMD and SMD abundance of 65 kg/km2 and 671 kg/km2, respectively, observed in 2016.
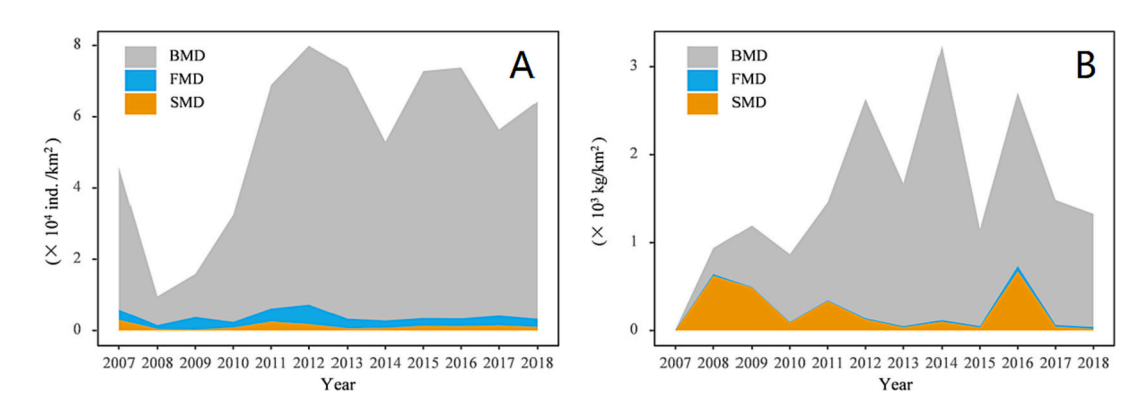
图 1 2007-2018年中国海域BMD、FMD和SMD的平均数(A)和重量密度(B)
Fig. 1. Mean number (A) and weight densities of BMD, FMD, and SMD (B) in China seas from 2007 to 2018.
2.2 海洋垃圾的材料和比例
2.2 Materials and proportions of marine debris
从成分上看,中国沿海海滩或海域的海洋垃圾包括塑料、聚苯乙烯泡沫塑料、木材、纸张、玻璃、金属、织物等。从数量上看,由于塑料的难可处置性,碎片的成分从不同的物品变成了单一的主要成分,即塑料,平均值为 SMD 的 70%。塑料、聚苯乙烯泡沫和木材是 FMD 的主要成分,因为它们重量轻且可漂浮。2007-2011 年期间,聚苯乙烯泡沫占碎片总量的约 30%,而这一比例在 2012-2015 年期间增加到约 50%。自 2016 年以来,在国家和地区针对限制聚苯乙烯泡沫的使用采取有效的对策后,其比例已降至接近零。相比之下,塑料已成为海洋垃圾越来越重要的组成部分,占海洋垃圾总量的近 90%(图 2)。与其他两种海洋垃圾类型相比,BMD 显示出更加多样化的成分,可以看到多种物品,例如塑料、聚苯乙烯泡沫塑料、木材、纸张、玻璃、金属、织物等。
In terms of composition, marine debris on the coastal beaches or in the seawaters of China comprised of plastic, polystyrene foam, wood, paper, glass, metal, fabric, etc. Quantitatively, the composition of debris changed from diverse items to a single dominant component, i.e., plastic, with a mean value of 70 % of SMD, owing to the disposability of plastics and the difficulties in cleaning up used plastics. Plastic, polystyrene foam, and wood were the main components of FMD due to their lightweight and floatability. During 2007–2011, polystyrene foam accounted for approximately 30 % of the total debris in FMD, and this proportion increased to approximately 50 % during 2012–2015. Since 2016, its proportion has decreased to nearly zero percent following effective national and regional countermeasures focused on limiting the use of polystyrene foam. In contrast, plastic has become an increasingly dominant component, accounting for nearly 90 % of the total marine debris. Compared with the other two MD types, BMD showed a more diverse composition with visibility of multiple items such as plastic, polystyrene foam, wood, paper, glass, metal, fabric, and others.
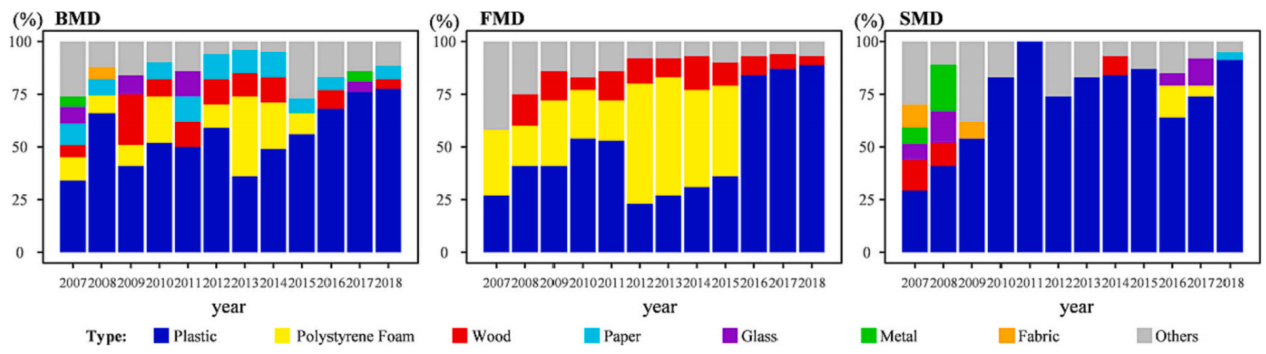
图2 2007-2018年中国各类海洋废弃物的碎片组成。
Fig. 3. Debris composition of each group of marine debris in China during 2007–2018.
2.3 中国海洋垃圾的数量和重量丰度
2.3 Abundance in number and weight of marine debris in China
海洋垃圾的丰度和分布取决于人类活动和海洋水文气象条件。从空间上看,海洋垃圾平均密度存在显着差异,如2018年中国海域小型海洋垃圾(小于等于10 cm)平均密度为0.42个/m3,渤海、黄海和南海分别为0.70 、0.40、0.18个/m3。但黄海海洋垃圾的数量和重量堆积率分别为1.08个/m3和39.67 g/m3,均高于其他地区。一方面,黄海主要被中国海岸洋流、黄海暖流和朝鲜海岸洋流包围,迫使陆地和沿海地区的塑料聚集在黄海中。同时,黄海暖流可以推动东海漂浮的塑料向北流向黄海,形成塑料含量高的带。此外,高度密集的捕鱼活动产生了一定量的废物,直接倾倒入海中。东海是一个敏感的生态系统,位于人口稠密、工业化程度高的地区,沿海经济活动频繁,如旅游、工程、航运和海水养殖。长江口沿岸塑料颗粒浓度为4200个/m3,东海椒江口、瓯江口、闽江口分别为960、680、1300个/m3。在南海北部,可能受雨季东南风的影响,塑料数量和重量均较高。在人口密度过大和人类活动过度的香港珠江,发现了数量惊人的 3422 亿颗微珠。
The abundance and distribution of marine debris are determined by human activity and marine hydrometeorological conditions. Spatially, the mean densities of marine debris showed significant differences, e.g., in 2018, the average density of small marine debris (size smaller than or equal to 10 cm) in the China Seas was 0.42 pieces/m3, with respective values of 0.70, 0.40, and 0.18 pieces/m3 in the Bohai Sea, Yellow Sea, and the South China Sea. The accumulation rates in number and weight of marine debris in the Yellow Sea were respectively 1.08 pieces/m3 and 39.67 g/m3, both higher than other areas (grey literature). The Yellow Sea is largely surrounded by the Chinese Coastal Current, Yellow Sea Warm Current, and Korean Coastal Current, which force plastic from land and coastal regions to gather in the Yellow Sea. Meanwhile, the Yellow Sea Warm Current can propel floating plastic in the East China Sea northwards to the Yellow Sea, forming a belt highly abundant in plastic. Furthermore, highly intensive fishing activities produced a certain amount of waste, which was directly dumped into the sea. The East China Sea is a sensitive ecosystem located in a densely populated and highly industrialized area with frequent coastal economic activities, such as tourism, engineering, shipping, and mariculture. The concentration of plastic particles on the coast of the Yangtze estuary was 4200 pieces/m3, and those in the Jiaojiang, Oujiang, and Minjiang estuaries of the East China Sea were 960, 680, and 1300 pieces/m3, respectively. In the northern South China Sea, possibly under the influence of the southeast wind during the wet season, FMD in terms of both number and weight were higher. In Pearl River, Hong Kong, with excessive population density and human activities, an astounding amount of 342.2 billion items of microbeads was discovered.
3.海洋垃圾的威胁
3. Threats of marine debris
海洋污染直接对海洋生物和人类造成重大伤害。迄今为止,已知有超过 1500 个物种受到海洋垃圾的影响。例如,在中国,玳瑁( Eretmochelys imbricata )和巨型棱皮龟(Dermochelys coriacea)极度濒危,而绿海龟( Chelonia mydas )、黑面琵鹭(Platalea minor)和长须鲸(Balaenoptera physalus)均为濒危物种,此外,刺角鲨(Squalus acanthias)、巨型蝠鲼(Manta birostris)和短鳍灰鲭鲨(Isurus oxyrinchus)也容易受到海洋垃圾的威胁。
Marine pollution causes significant harm directly to marine organisms and human beings. To date, >1500 species are known to be affected by marine debris, a number higher than the previous estimation, most of which are endangered or vulnerable to marine debris. For instance, in China, the hawksbill turtle (Eretmochelys imbricata) and giant leatherback turtle (Dermochelys coriacea) are critically endangered, while green sea turtle (Chelonia mydas), black-faced spoonbill (Platalea minor), and fin whale (Balaenoptera physalus) are all endangered species, additionally, spiny dogfish (Squalus acanthias), giant manta ray (Manta birostris), shortfin mako shark (Isurus oxyrinchus), and most species of the genus Pterodroma (gadfly petrels) are also vulnerable to threat from marine debris.
海洋塑料对生态系统的影响主要通过纠缠、误食、有毒渗滤液、栖息地破坏以及成为从个体到生态系统不同层面的物种入侵的帮凶(图3)。捕鱼活动会产生大量垃圾,例如废弃的塑料捕鱼工具,以及渔民产生的生活垃圾。流入海洋的塑料物体可能会缠绕在生物体(即珊瑚和海草)上并严重影响其生理功能(即呼吸、进食或光合作用)。
Marine plastics impact the ecosystem primarily through entanglement, inadvertent eating, toxic leachate, habitat destruction, and accomplices of species invasion at different levels from the individual to the ecosystem. Fishing activities generate significant amounts of litter, such as discarded plastic fishing tools, as well as domestic waste generated by fishermen. The plastic objects disposed into the ocean may be entangled on organisms (i.e., coral and seagrass) and seriously impact their physiological functions (i.e., breathing, feeding, or photosynthesis).
其次,浮动塑料可能充当有毒化学物质(如双酚A 和邻苯二甲酸盐)的载体。这些有毒物质可以从微塑料中浸出到环境中,并且很容易被人类作为食物消费的各种海洋生物吸收,包括鱼类、双壳类和甲壳类动物。摄入的毒素会通过生物蓄积和生物放大过程在人体中积累和放大,并可能导致癌症和内分泌失调。在中国,通过食用贝类摄入的微塑料在世界上排名第三,平均每人每年摄入6636 个颗粒,仅次于意大利和加拿大。
Floating plastics may act as vehicles for toxic chemicals such as bisphenol A and phthalates. These can be leached from microplastics into the environment, and easily be absorbed into a wide range of marine organisms consumed by humans as food, including fish, bivalves and crustaceans. The ingested toxins would accumulate and magnify in human bodies through bioaccumulation and biomagnification processes, and may cause cancer and endocrine disorders. In China, dietary exposure to microplastics through shellfish consumption ranked 3rd in the world, averaging 6,636 particles per person per year, after Italy and Canada
而在开阔的海床上,塑料碎片会阻碍海水与沉积物之间的水气交换,从而危及沉积物中的生物。特别是中国沿海的河口,是许多鱼类重要的产卵或觅食地,尤其受到海洋垃圾的威胁,可能导致渔业资源的减少。
Whereas on the open seabed, plastic debris can prevent water and gas exchange between seawater and sediments, thereby endangering living organisms in the sediments. In particular, estuaries along China's coast, being important spawning or feeding grounds for many fish species, are especially threatened by marine debris, and may contribute to the decline of fishery resources.
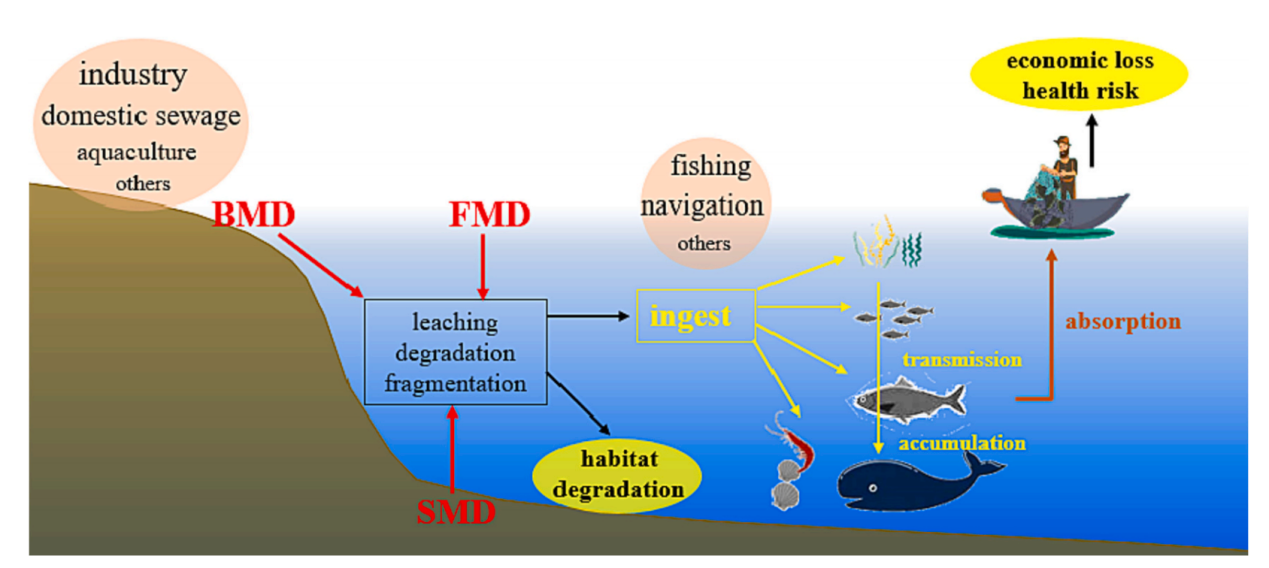
图3 海洋废弃物途径和潜在影响的概念模型,包括来自陆地和海洋的来源、海洋废弃物的类型、废弃物分解进入水中的途径、通过摄取在生物体之间的运输途径以及威胁。
Fig. 3. Conceptual model of marine debris pathways and potential impacts, including sources from land-based and ocean-based, types of marine debris, pathways of debris decomposition into the water, transport pathways among organisms by ingestion, and threats.
4.对策
4. Countermeasures
(1)设置管理机构,包括环境保护、发展改革、水利和市政管理的不同方面,以有效地解决问题。
(2)落实“陆海统筹”、“江海共治”等机制。
(3)应依托专业机构或大学开展漂流垃圾预报。
(4)不断增强公众的海洋环境保护意识。
(1) A specialized agency is needed, either official or non-profit organization, including different aspects of environmental protection, development and reform, water conservancy, and municipal administration, to solve problems efficiently.
(2) Mechanisms such as ‘Land and Sea Co-ordination’ and ‘River-Sea Co-governance’ should be implemented.
(3) The forecasting of drifting waste should be carried out, relying on professional institutes or universities.
(4) Public awareness of marine environmental protection needs to be continuously strengthened.
参考文献:
[1] Kang B, Lin L, Li Y, et al. Facing marine debris in China[J]. Marine Pollution Bulletin, 2022, 184: 114158.
 公众号
公众号